Data Exploration & Profiling
Get oriented in unfamiliar connections using MarcoPolo.
You just set up a connection and have no idea what's in it. Or you inherited a warehouse with 200 tables and need to figure out which ones matter. This is where exploration starts.
Exploring the Snowflake demo in Claude Code
Here's a real exploration session against the Snowflake demo connection. Install it first if you haven't:
Install the Snowflake demo.
AI calls install_demo_connection(demo_connection="snowflake-demo")
   → success: true → connections/snowflake-demo/
Now explore.
What's in the Snowflake demo connection?
AI runs workspace_shell("connection describe snowflake-demo --database ANALYTICS --json")
   → 3 tables: CUSTOMERS (10 rows), ORDERS (17 rows), PRODUCT_METRICS (16 rows)
Profile the ORDERS table. Show me column types, null rates, and value distributions.
AI runs workspace_shell("connection describe snowflake-demo --database ANALYTICS --table ORDERS --json")
   → 8 columns: ORDER_ID, CUSTOMER_ID, ORDER_DATE, ORDER_AMOUNT,
     ORDER_STATUS, SHIPPING_COUNTRY, PRODUCT_CATEGORY, CREATED_AT

AI writes connections/snowflake-demo/queries/profile_orders.sql
AI runs workspace_shell("connection query snowflake-demo --file connections/snowflake-demo/queries/profile_orders.sql --json")
   → DuckDB relation: snowflake_demo_profile_orders

AI: ORDERS: 17 rows, date range 2024-10-05 to 2024-12-15
    - 10 unique customers, 9 countries, 5 product categories
    - ORDER_AMOUNT: $123.00 to $1,750.40, avg $808.06
    - No NULLs in any column
    - 4 statuses: DELIVERED (11), SHIPPED (3), PENDING (2), CANCELLED (1)
Show me how the tables relate to each other.
AI runs workspace_shell("connection describe snowflake-demo --database ANALYTICS --table CUSTOMERS --json")
AI runs workspace_shell("connection describe snowflake-demo --database ANALYTICS --table PRODUCT_METRICS --json")
AI: Join paths:
ORDERS.CUSTOMER_ID -> CUSTOMERS.CUSTOMER_ID
ORDERS.PRODUCT_CATEGORY -> PRODUCT_METRICS.PRODUCT_CATEGORY
CUSTOMERS is the reference table (10 rows, one per customer).
ORDERS has the transactional data (17 rows).
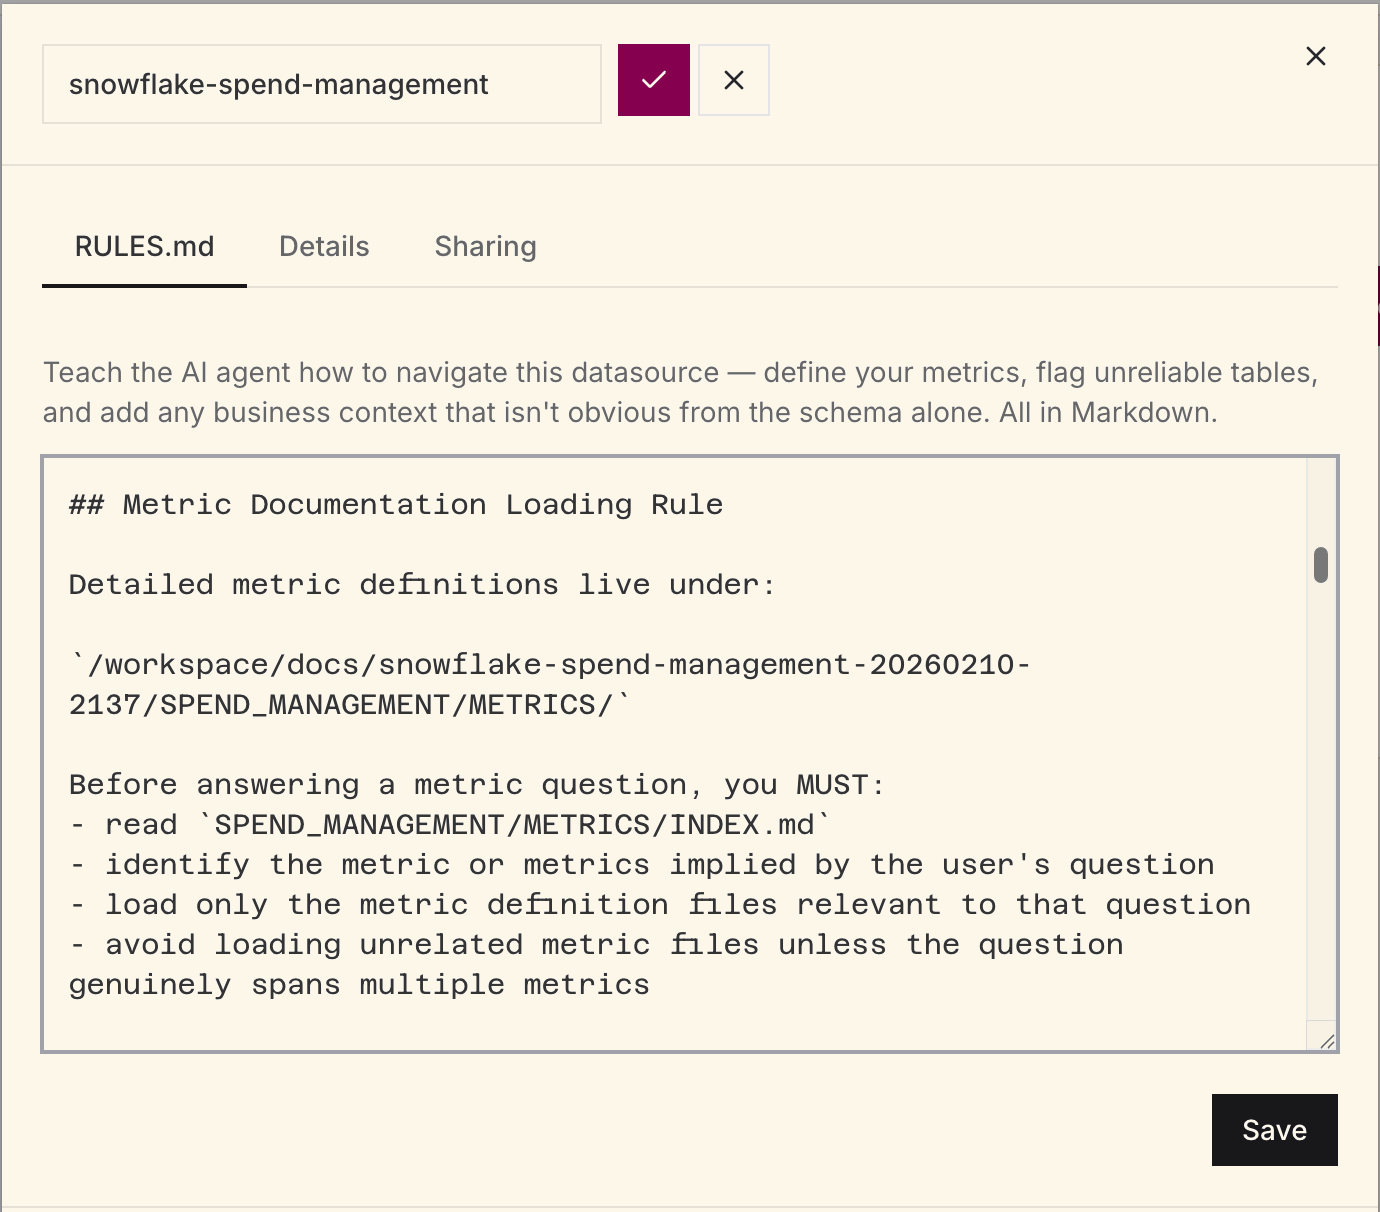
PRODUCT_METRICS aggregates by category and date (16 rows).Save what you learned to RULES.md.
AI runs workspace_shell("""cat > connections/snowflake-demo/RULES.md <<'MD' …MD""")

AI: Updated connections/snowflake-demo/RULES.md:
    - CUSTOMERS: 10 customers across 9 countries. One INACTIVE (Ethan Hunt).
    - ORDERS: transactional, Oct-Dec 2024. Join to CUSTOMERS on CUSTOMER_ID.
    - PRODUCT_METRICS: pre-aggregated by category and date. Join to ORDERS
      on PRODUCT_CATEGORY.
    - No NULL issues in any table.
After this session, the RULES.md, query files, and metadata snapshots persist under connections/snowflake-demo/. The next conversation starts with this context already available.
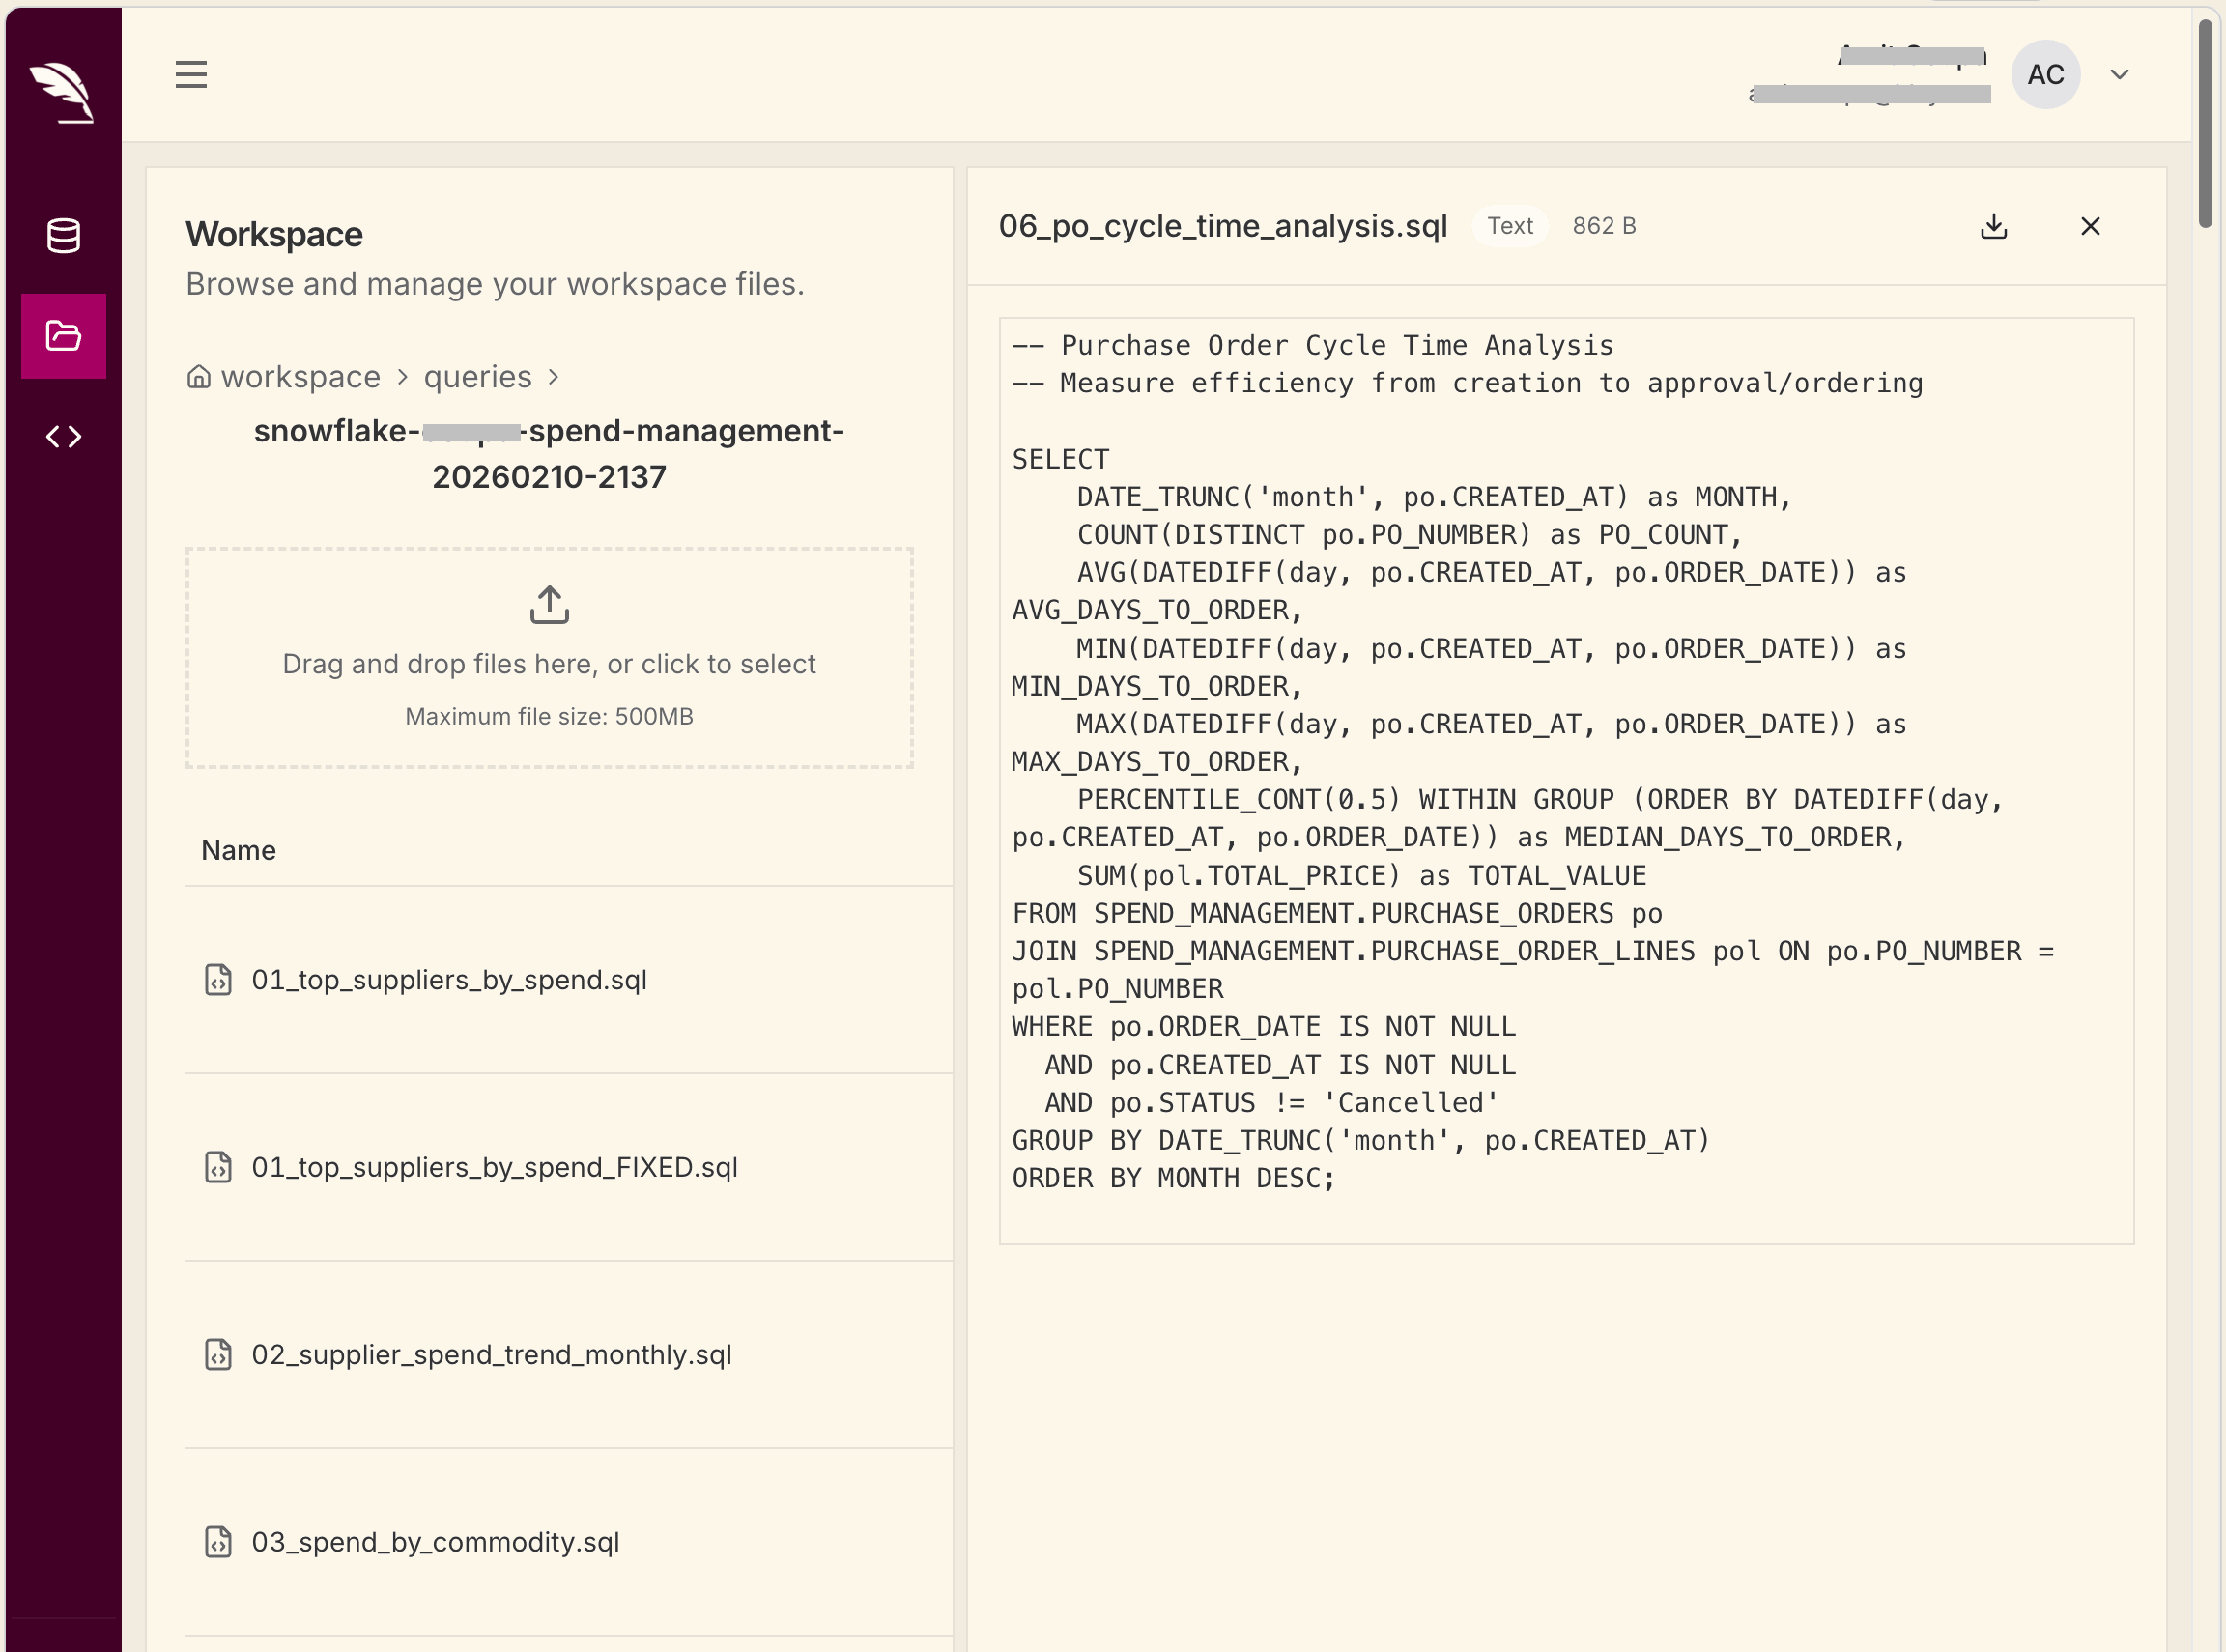
That persistent context matters. Strong exploration sessions do two things: document what the AI should remember in RULES.md, and leave behind reusable query files in connections/<name>/queries/ so later analysis starts from known-good patterns.
How real teams use this
A manufacturing QC team connected their Microsoft Fabric SQL Analytics endpoints and ran a similar flow: surveyed 3 schemas with 47 tables, profiled the key quality tables, discovered a 12% NULL rate in a grade column (grading system introduced mid-year), and documented all of it in RULES.md. Every subsequent analysis session started from that baseline.
A RevOps team connected Salesforce and discovered 656 objects in the org. Rather than exploring all of them, they asked Claude to filter to the objects with data (Account, Opportunity, Contact, Lead) and profiled those. Within 20 minutes they had a working RULES.md with join paths and metric definitions.
The pattern
- Survey the landscape. Start broad. Ask for all schemas, all tables, grouped by topic.
- Drill into what matters. Pick the tables that are relevant and profile them at the column level.
- Check data quality. Null rates, unique values, value distributions. Surfaces gotchas before they cause wrong analysis.
- Map relationships. Understand join paths between tables, especially in complex schemas.
- Save the context. Write what you learned to RULES.md. Future sessions start from this baseline.
Good prompts for exploration
List all tables in the analytics schema with row counts and
descriptions of what each one likely contains.
Profile the events table: row count by day for the last 90 days,
null rate per column, and the top 20 most common event types.Are there any duplicate primary keys, orphaned foreign keys,
or tables that look like they haven't been updated recently?Which tables contain customer data? Show me how they relate
to each other and which one is the canonical source.